
Data, meet business
An intro to data models for analysts with a short case study on Flappy Bird
Data models are aggregated daily tables created on top of raw data and based on business logic. They make analytics easier, faster, more accurate, and way less frustrating.
When we talk about automation, we are really talking about building and refreshing these data models.
These tables feed into the dashboards, data requests, and common analysis requirements. For example, if you have a retention page on your dashboard with 8 different retention charts - retention by source, by engagement type, by country, by device, etc. - you can either write the retention subquery 8 times or create a ‘retention’ model and just join it with the other conditions to get your charts.
This way, you get the same retention definition, and you get shorter queries.
Data models help the analytics team stick to one definition for all important metrics as the models are built by calculating the key metrics. Once the metric is calculated and stored in the table, you can pull it from this table instead of writing a fresh query.
I used to call these tables aggregate tables as they are formed by aggregating daily data (group by), but they are also called abstract tables, data models, data layers, etc.
Data models are just tables where we have grouped data so we can write queries very quickly on top of them instead of referring to raw data for every data requirement.
My definition does not align with the technical definition of a data model - because it’s usually a domain of data engineers. I think of data models as a data representation of the business model.
And that brings us to the “Business Model”. For our purpose, the business model is the process by which a business gets revenue from its users.
Don't confuse the business model with just the monetization (the money-making) part of the business. It is the entire journey from user acquisition to monetization. After all, every component of a business is ultimately in service to monetize users.
So, a business model can be broken down into components like marketing, engagement, retention, referrals, and activation. As business models vary from one company to another, so do the data models.
That’s why we have to learn how to build our own. Let’s start with the simplest businesses - hypercasual games. For this post, I will focus on the process. In future posts, I will share complete data models for different business models.
Data Models for a Hypercasual Game
Do you remember the Flappy Bird game? It had only one action - tap to make the bird jump through the gaps. There was nothing else.

How do you get profit in a business like Flappy Bird? By generating more revenue from ads than you spend on acquiring users through marketing. This translates to:
acquire users cheaply (acquisition)
keep them engaged as long as possible (engagement and activation)
keep them returning as often as possible (retention)
maximize Ad-revenue (monetization)
get some virality (referrals)
At Flappy Bird, the PM and founder will obsess over the above metrics. As there are no features apart from the gameplay, the main focus is the quality and difficulty curve of the game and some levers for virality. The business questions will be:
how much are spending on acquiring users
are we making back enough from the users
when do we breakeven for different acquisition channels, countries
how many users start a game and finish it - with win or loss
then what happens, do they go and play another game?
in a session, how many games does a user start -
how does this differ by new vs returning users
what % of users / playing users / winning users refer our game
what is the retention curve of the game - what % return the next day, the next week
what is the breakup of revenue from a cohort of users -
do we make more revenue upfront
or do we make revenue from retained users
After every release and major gameplay change, analytics will get the same questions with some additional conditions.
If you are an analyst at Flappy Bird, you would write the same queries with small variations every week. If a different analyst writes the queries and the data doesn’t match, that’s another headache (and one we all are used to).
This is where data models come into play.
Instead of querying raw data (as I did initially in my career), you can define these metrics and automate them as daily tables - even refresh them 2-3 times a day if needed. I don’t recommend it though - getting data once a day is enough.
With the above business questions as our priority, we can create the below data models-
a user table - to track details about a user like source, app version, platform, country
a user active table - to track each date when the user is active, number of sessions on that day, the number of games, and games won, an array with the ids of games played
a games table - to track the outcome of each game- this can include info that the user played another game or not, or a level up at the end of the game, etc.
an Ads table - to keep a daily / session level tab on ads seen by a user, and revenue earned
a referral table to track referrals
These are based on raw data and can be updated 1-2 times daily. But these are not final yet. You can build a few more tables on top of the above models -
daily engagement summary: this combines all the above for a daily summary
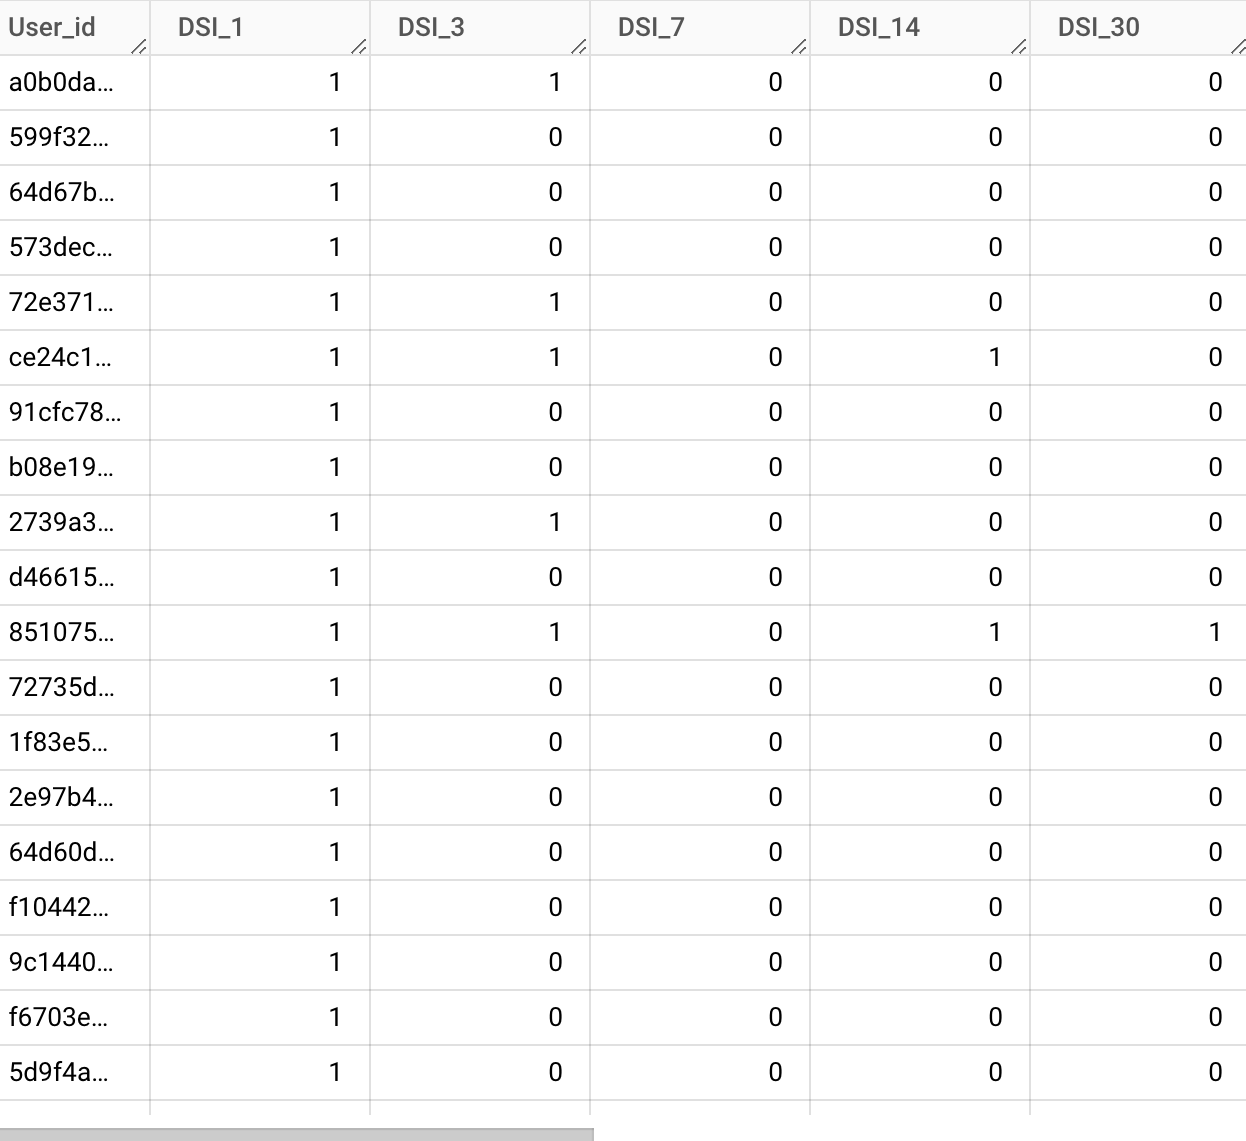
a retention summary: similar to the snapshot at the top of this post
daily users summary: summary for new users acquired on the day
These second-level tables are flexible - you can change the definitions/columns anytime you like or create a new table. This layer comes in handy for two reasons -
definitions change over time - and you don't want to go back to your 2-year-old raw data! (also you probably will delete it anyway to save storage costs)
you can add a new table when a new use case comes up without worrying about disturbing old data
The first layer is just a cleaner and more useful version of your raw data so you don't have to struggle with data errors every time you write a query.
With these tables in place, the analytics team can easily save 50% or more time and spend that in more advanced analytics instead. Isn’t that what we all want to do?
--
This was the simplest data model. Below are other business models that are common in digital products:
subscription - spotify, apple, youtube
one time membership purchase - casual games, online courses
software sales to users (blocksite, grammarly)
alternate currency - diamonds / boosts - Tinder
simple e-comm model: any d2c
product sales to businesses (zoho, google suite)
marketplaces: zomato, amazon, flipkart, zepto
I have placed them in increasing order of complexity and will cover some of them in the coming weeks.
More complexity often means more and bigger tables. If your startup has a complex model, don’t worry! You don't need to come up with 'final' models in the first version. The process for making data models is iterative - you start with the simplest versions and then add more columns as needed, or add more tables.
Remember: they should make your life easy tomorrow. If you try to make ‘final’ data models in the first iteration, you will be stuck for a very long time.
If you are here: Would you like to collaborate on the posts where I cover the above business models? Drop a comment here, or DM me on linkedin.
Resources:
this ebook from holistics data is a complete guide to the nuts and bolts of data modeling if want to dig into the topic. It was my go-to guide many years ago.